Experiment analyser
alipy.experiment.ExperimentAnalyser
is a class to gathering, processsing and
visualizing your experiment results.
This class mainly has the following functions:
1. Extract the raw data of a list of
alipy.experiment.StateIO
object for plotting.
2. Plot the experiment results of different strategies. (Include Validity checking, Interpolating, alignment, etc.)
In the following content, we will introduce the basic usages of this class.
Initialize
When initializing, you need to specify the x_axis type of your result data which should be 'num_of_queries' if your result data is aligned by number of queries; or 'cost' if you are performing a cost-sensitive experiment.
from alipy.experiment import ExperimentAnalyser
analyser = ExperimentAnalyser(x_axis='num_of_queries')
Add results
Before plotting, you should add all results of compared methods through
add_method(method_name, method_results)
. Some validity checking according to the different active learning setting
will be performed automatically. e.g., the continuity of batch_size, number of queries, total cost, etc.
Analyser object accept 3 types of results data for 2 different active learning setting ('num_of_queries', 'cost'). Normally, the results should be a list which contains k elements. Each element represents one fold experiment result. Legal result object includes:
-
StateIO
object which stores k
State
object for k queries.
- A list contains n performances for n queries.
- A list contains n tuples with 2 elements, in which, the first element is the x_axis (e.g., iteration, accumulative_cost), and the second element is the y_axis (e.g., the performance)
Number of queries
For the number of queries setting, we accept the 1st and 2nd types of results.
radom_result = [[0.6, 0.7, 0.8, 0.9], [0.7, 0.7, 0.75, 0.85]]  # 2 folds, 4 queries for each fold.
uncertainty_result = [saver1, saver2] # 2 StateIO object for 2 folds experiments
from alipy.experiment import ExperimentAnalyser
analyser = ExperimentAnalyser(x_axis='num_of_queries')
analyser.add_method('random', radom_result)
analyser.add_method('uncertainty', uncertainty_result)
Cost sensitive
For the cost sensitive setting, we accept 1st and 3rd types of results. Note that, the result data you are providing must contain cost information.
radom_result = [[(1, 0.6), (2, 0.7), (2, 0.8), (1, 0.9)],
                [(1, 0.7), (1, 0.7), (1.5, 0.75), (2.5, 0.85)]]  # 2 folds, 4 queries for each fold.
uncertainty_result = [saver1, saver2]  # each State object in the saver must have the 'cost' entry.
from alipy.experiment import ExperimentAnalyser
analyser = ExperimentAnalyser(x_axis='cost')
analyser.add_method('random', radom_result)
analyser.add_method('uncertainty', uncertainty_result)
Plot
The plot function in
ExperimentAnalyser
provide many options for
plotting.
Some useful options are:
- start_point: float, optional (default=None).
Set the start point for all methods if you
are not set the initial point when initializing the
StateIO
object.
- title: str, optioanl (default=None). The title of the figure
- plot_interval: int, optioanl (default=1). The interval (x_axis) of each two data point.
- std_area: bool, optional (default=False). Whether to show the std area in your multi-fold experiment.
- show: bool, optioanl (default=True). Whether to show the figure. If False, it will return the matplotlib.pyplot object directly.
- saving_path: str, optional (default='.') The path to save the image. Passing None to disable the saving.
Note that, the length of results in the cost sensitive setting can be different. A interpolate will be performed automatically to align each result of compared methods.
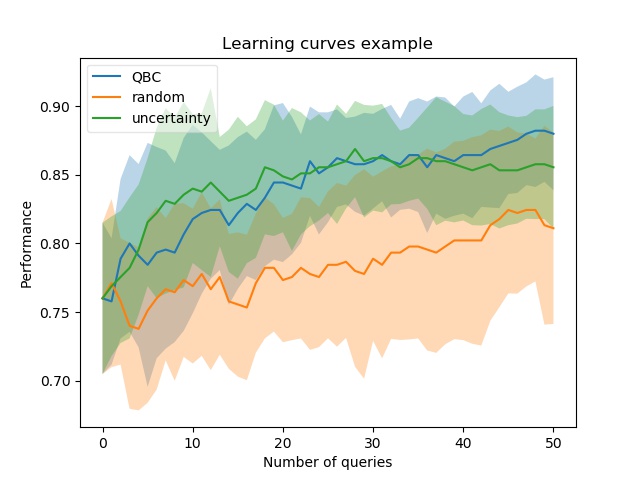
Finally, you can show the learning curves by invoking
plot_learning_curves()
.
analyser.plot_learning_curves(title='Learning curves example', std_area=True)
If you want to customize the style of the plot, you can pass
show=False
to the plot_learning_curves function to disable showing the image. It will return the matplotlib.pyplot object so that you can further modify any attributes of it.
plt = analyser.plot_learning_curves(title='Learning curves example', std_area=True, show=False)
plt.title('my_custom_title')
plt.show()